
Figure 1. Number of Exploit URLs and sites as a Function of Patch Levels (May/June 2005 data)
The SP2-FP numbers again demonstrate the importance of keeping software up to date: none of the 752
exploit URLs was able to exploit a fully updated WinXP SP2 machine according to our May/June 2005 data. If
any Web site that exploits a zero-day vulnerability ever appears and gets connected to any of these URLs, our
SP2-FP HoneyMonkey will be able to quickly detect and report it to the browser and security response teams.
This hopefully creates a dilemma that discourages the exploiters: most of the future exploit pages will likely
get detected before they have a chance to cause large-scale infections because HoneyMonkeys browse the Web
like humans and the first HoneyMonkey that gets infected can report the exploit.
Connection Topology based on Traffic Redirection
Next, we present the topology graph for each of the first three patch levels and discuss what we can learn
from each graph
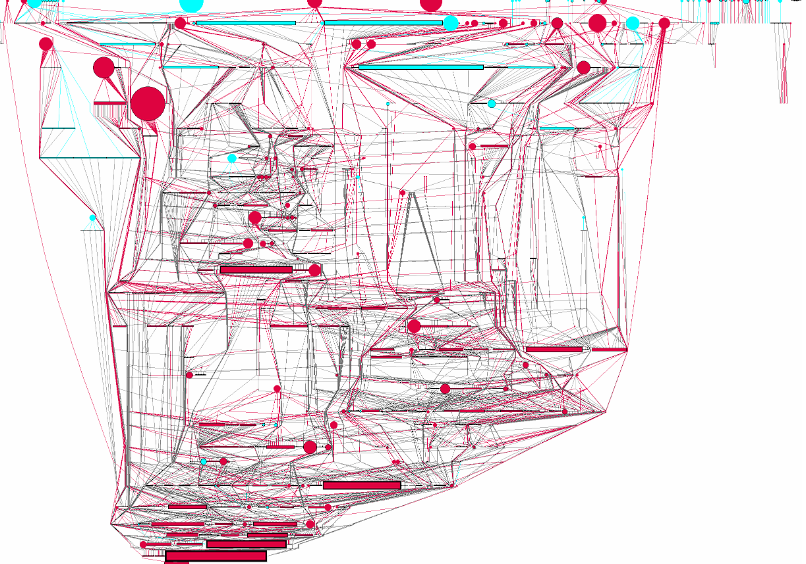
“WinXP SP1 Unpatched” Topology
Figure 2 shows the URL-level topology graph for WinXP SP1-UP. Each rectangular node represents an
individual exploit URL. Blue nodes represent Web pages that did not receive redirected traffic from any other
nodes; they are most likely content providers and not major exploit providers. In contrast, red nodes represent
Web pages that received redirected traffic from other exploit pages; they are most likely exploit providers if the
traffic came from multiple different sites. Each gray edge represents an automatic traffic redirection. Each
circle represents a site node that serves as an aggregation point for all exploit pages hosted on that site, with the
site node having one blue or red edge pointing to each of the child-page rectangles. Any circle without a border
is a “virtual site node” that does not correspond to an exploit URL, but is introduced purely for aggregation
purposes.
The size of a circle is proportional to the number of outgoing gray edges for blue nodes and the number of
incoming gray edges for red nodes. Such numbers provide a good indication of the relative popularity of the
exploit sites and will be referred to as the connection counts. The top exploit site in this graph has a
connection count of 63; the top exploit page has a count of 29; the largest blue circle at the top has a count of
If available, actual amount of visit traffic to each exploit site can provide a more accurate picture of the
relative popularity.