

Basic Setup
Start by downloading this Gist from Part 1, and then run it using the following command:
$ bash bottle.sh
This will create a basic project structure:
├── app.py
├── requirements.txt
└── testenv
Activate the virtualenv:
Install the requirements:
$ pip install -r requirements.txt
Navigate to https://www.plot.ly/api, sign up for a new account, sign in, and then create a new API key:
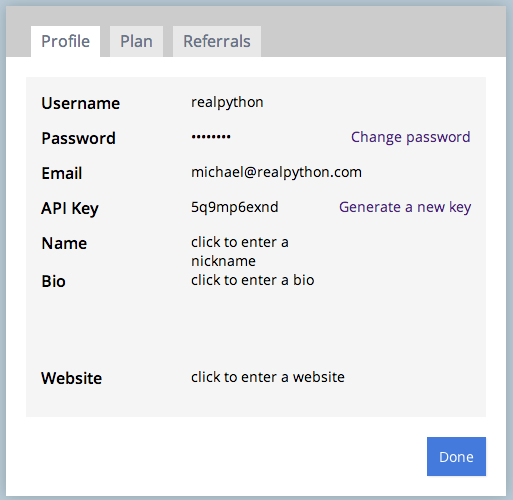
Copy that key.
Whats going on here?
The first function, form(), creates an HTML form for capturing the data we need to make a simple bar graph.
Meanwhile, the second function, submit(), grabs the form inputs, assigns them to variables, then calls the plot.ly API, passing our credentials as well as the data, to generate a new chart. Make sure you replace my username and API key with your own credentials. DO NOT use mine. It will not work.
Test
Run your app locally, python app.py, and point your browser to http://localhost:8080/plot.
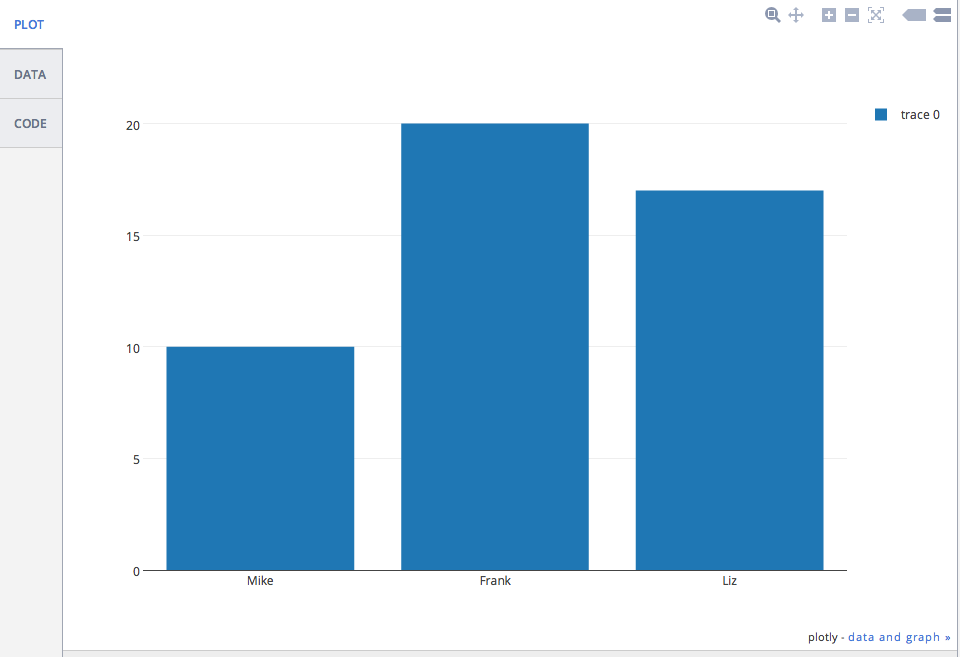
Enter the names of three people and their respective ages. Press submit, and then if all is well you should see a congrats message and a URL. Click the URL to view your graph:
If you get a 500 error with this message - Aw, snap! Looks like you supplied the wrong API key. Want to try again? You can always view your key at https://plot.ly/api/key. When you display your key at https://plot.ly/api/key, make sure that you're logged in as realpython. - you need to update your API key.
Also, if this were a real, client-facing app, you would want to handle errors much, MUCH more gracefully than this. Just FYI.
Cohort Analysis
Next, lets look at a more complicated example to create a graph for the following cohort analysis stats:
Well be building off of the same app - app.py, but create a new file: Open app.py then Save As cohort.py.
Start by upgrading to the Simple Template Engine, so we can add styles and Javascript files to our templates. Add a new folder called views then create a new file in that directory called template.tpl. Add the following code to that file:
Create a data.json file and add your Plot.ly username and API key. You can view the sample file here.
Add the following code to cohort.py in order to access the data.json to use the credentials when we make the API call:
Now we dont have to expose our key to the entire universe. Just make sure to keep it out of version control.
Next update the functions:
Notice the return statement. Were passing in the name of the template, plus any variables. Lets create that new template called template2.tpl:
So the iframe allows us to update the form then display the actual content/chart, with the updated changes. We do not have to leave the site to view the graph, in other words.
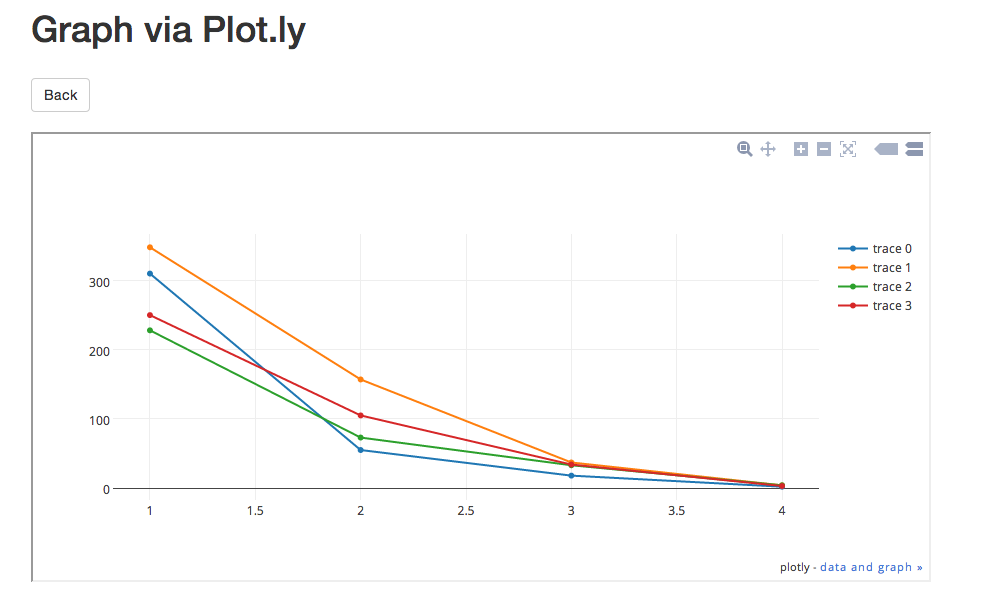
Run it. Add values to the form. Then submit. Your graph should now look like this:
You can grab all the files from this repo. https://github.com/mjhea0/bottle-plotly-python
See you next time!
This post is quoted
Start by downloading this Gist from Part 1, and then run it using the following command:
$ bash bottle.sh
This will create a basic project structure:
├── app.py
├── requirements.txt
└── testenv
Activate the virtualenv:
Kod:
$ cd bottle
$ source testenv/bin/activate$ pip install -r requirements.txt
Navigate to https://www.plot.ly/api, sign up for a new account, sign in, and then create a new API key:
Copy that key.
Kod:
Install plot.ly:
$ pip install plotly==1.2.6
Next update the code in app.py:

import os
from bottle import run, template, get, post, request

import plotly.plotly as py
from plotly.graph_objs import *


# add your username and api key
py.sign_in("realpython", "lijlflx93")


 [USER=675520]Get[/USER]('/plot')
def form():
    return '''<h2>Graph via Plot.ly</h2>
              <form method="POST" action="/plot">
                Name: <input name="name1" type="text" />
                Age: <input name="age1" type="text" /><br/>
                Name: <input name="name2" type="text" />
                Age: <input name="age2" type="text" /><br/>
                Name: <input name="name3" type="text" />
                Age: <input name="age3" type="text" /><br/>
                <input type="submit" />
              </form>'''


 [USER=751066]post[/USER]('/plot')
def submit():
    # grab data from form
    name1 = request.forms.get('name1')
    age1 = request.forms.get('age1')
    name2 = request.forms.get('name2')
    age2 = request.forms.get('age2')
    name3 = request.forms.get('name3')
    age3 = request.forms.get('age3')

    data = Data([
        Bar(
            x=[name1, name2, name3],
            y=[age1, age2, age3]
        )
    ])

    # make api call
    response = py.plot(data, filename='basic-bar')

    if response:
        return template('''
            <h1>Congrats!</h1>
            <div>
              View your graph here: <a href="{{response}}"</a>{{response}}
            </div>
            ''',
            response=response
        )

if __name__ == '__main__':
    port = int(os.environ.get('PORT', 8080))
run(host='0.0.0.0', port=port, debug=True)The first function, form(), creates an HTML form for capturing the data we need to make a simple bar graph.
Meanwhile, the second function, submit(), grabs the form inputs, assigns them to variables, then calls the plot.ly API, passing our credentials as well as the data, to generate a new chart. Make sure you replace my username and API key with your own credentials. DO NOT use mine. It will not work.
Test
Run your app locally, python app.py, and point your browser to http://localhost:8080/plot.
Enter the names of three people and their respective ages. Press submit, and then if all is well you should see a congrats message and a URL. Click the URL to view your graph:
If you get a 500 error with this message - Aw, snap! Looks like you supplied the wrong API key. Want to try again? You can always view your key at https://plot.ly/api/key. When you display your key at https://plot.ly/api/key, make sure that you're logged in as realpython. - you need to update your API key.
Also, if this were a real, client-facing app, you would want to handle errors much, MUCH more gracefully than this. Just FYI.
Cohort Analysis
Next, lets look at a more complicated example to create a graph for the following cohort analysis stats:
Kod:
Cohort	2011	2012	2013	2014
0	310	348	228	250
1	55	157	73	34
2	18	37	33	34
3 2 4 4 3Start by upgrading to the Simple Template Engine, so we can add styles and Javascript files to our templates. Add a new folder called views then create a new file in that directory called template.tpl. Add the following code to that file:
Kod:
<!DOCTYPE html>
<html>
  <head>
    <**** charset="utf-8">
    <title>{{ title }}</title>
    <**** name="viewport" content="width=device-width, initial-scale=1.0">
    <link href="http://netdna.bootstrapcdn.com/bootstrap/3.0.0/css/bootstrap.min.css" rel="stylesheet" media="screen">
    *********
      body {
        padding: 60px 0px;
      }
    </style>
  </head>
  <body>
    <div class="container">
      <h1>Graph via Plot.ly</h1>
      <form role="form" method="post" action="/plot">
        <table>
            <td>
              <h3>2011</h3>
              <div class="form-group" "col-md-2">
                <input type="number" name="Y01" class="form-control" placeholder="Cohort 0">
                <input type="number" name="Y02" class="form-control" placeholder="Cohort 1">
                <input type="number" name="Y03" class="form-control" placeholder="Cohort 2">
                <input type="number" name="Y04" class="form-control" placeholder="Cohort 3">
              </div>
            </td>
            <td>
              <h3>2012</h3>
              <div class="form-group" "col-md-2">
                <input type="number" name="Y11" class="form-control" placeholder="Cohort 0">
                <input type="number" name="Y12" class="form-control" placeholder="Cohort 1">
                <input type="number" name="Y13" class="form-control" placeholder="Cohort 2">
                <input type="number" name="Y44" class="form-control" placeholder="Cohort 3">
              </div>
            </td>
            <td>
              <h3>2013</h3>
              <div class="form-group" "col-md-2">
                <input type="number" name="Y21" class="form-control" placeholder="Cohort 0">
                <input type="number" name="Y22" class="form-control" placeholder="Cohort 1">
                <input type="number" name="Y23" class="form-control" placeholder="Cohort 2">
                <input type="number" name="Y24" class="form-control" placeholder="Cohort 3">
              </div>
            </td>
            <td>
              <h3>2014</h3>
              <div class="form-group" "col-md-2">
                <input type="number" name="Y31" class="form-control" placeholder="Cohort 0">
                <input type="number" name="Y32" class="form-control" placeholder="Cohort 1">
                <input type="number" name="Y33" class="form-control" placeholder="Cohort 2">
                <input type="number" name="Y34" class="form-control" placeholder="Cohort 3">
              </div>
            </td>
          </tr>
        </table>
        <button type="submit" class="btn btn-default">Submit</button>
      </form>
    </div>
    <script src="http://code.jquery.com/jquery-1.10.2.min.js"></script>
    <script src="http://netdna.bootstrapcdn.com/bootstrap/3.0.0/js/bootstrap.min.js"></script>
  </body>
</html>
As you can probably tell, this looks just like an HTML file. The difference is that we can pass Python variables to the file using the syntax - {{ python_variable }}.
Create a data.json file and add your Plot.ly username and API key. You can view the sample file here.
Add the following code to cohort.py in order to access the data.json to use the credentials when we make the API call:
Kod:
import os
from bottle import run, template, get, post, request

import plotly.plotly as py
from plotly.graph_objs import *

import json

# grab username and key from config/data file
with open('data.json') as config_file:
    config_data = json.load(config_file)
username = config_data["user"]
key = config_data["key"]

py.sign_in(username, key)Next update the functions:
Kod:
import os
from bottle import run, template, get, post, request

import plotly.plotly as py
from plotly.graph_objs import *

import json

# grab username and key from config/data file
with open('data.json') as config_file:
    config_data = json.load(config_file)
username = config_data["user"]
key = config_data["key"]

py.sign_in(username, key)


 [USER=675520]Get[/USER]('/plot')
def form():
    return template('template', title='Plot.ly Graph')


 [USER=751066]post[/USER]('/plot')
def submit():
    # grab data from form
    Y01 = request.forms.get('Y01')
    Y02 = request.forms.get('Y02')
    Y03 = request.forms.get('Y03')
    Y04 = request.forms.get('Y04')
    Y11 = request.forms.get('Y11')
    Y12 = request.forms.get('Y12')
    Y13 = request.forms.get('Y13')
    Y14 = request.forms.get('Y14')
    Y21 = request.forms.get('Y21')
    Y22 = request.forms.get('Y22')
    Y23 = request.forms.get('Y23')
    Y24 = request.forms.get('Y24')
    Y31 = request.forms.get('Y31')
    Y32 = request.forms.get('Y32')
    Y33 = request.forms.get('Y33')
    Y34 = request.forms.get('Y34')

    trace1 = Scatter(
        x=[1, 2, 3, 4],
        y=[Y01, Y02, Y03, Y04]
    )
    trace2 = Scatter(
        x=[1, 2, 3, 4],
        y=[Y11, Y12, Y13, Y14]
    )
    trace3 = Scatter(
        x=[1, 2, 3, 4],
        y=[Y21, Y22, Y23, Y24]
    )
    trace4 = Scatter(
        x=[1, 2, 3, 4],
        y=[Y31, Y32, Y33, Y34]
    )

    data = Data([trace1, trace2, trace3, trace4])

    # api call
    plot_url = py.plot(data, filename='basic-line')

    return template('template2', title='Plot.ly Graph', plot_url=str(plot_url))

if __name__ == '__main__':
    port = int(os.environ.get('PORT', 8080))
    run(host='0.0.0.0', port=port, debug=True)
Kod:
<!DOCTYPE html>
<html>
  <head>
    <**** charset="utf-8">
    <title>{{ title }}</title>
    <**** name="viewport" content="width=device-width, initial-scale=1.0">
    <link href="http://netdna.bootstrapcdn.com/bootstrap/3.0.0/css/bootstrap.min.css" rel="stylesheet" media="screen">
    *********
      body {
        padding: 60px 0px;
      }
    </style>
  </head>
  <body>
    <div class="container">
      <h1>Graph via Plot.ly</h1>
      <br>
      <a href="/plot"><button class="btn btn-default">Back</button></a>
      <br><br>
      <iframe id="igraph" src={{plot_url}} width="900" height="450" seamless="seamless" scrolling="no"></iframe>
    </div>
    <script src="http://code.jquery.com/jquery-1.10.2.min.js"></script>
    <script src="http://netdna.bootstrapcdn.com/bootstrap/3.0.0/js/bootstrap.min.js"></script>
  </body>
</html>Run it. Add values to the form. Then submit. Your graph should now look like this:
You can grab all the files from this repo. https://github.com/mjhea0/bottle-plotly-python
See you next time!
This post is quoted