


Hello Turk Hack Team Members, In this topic, I will explain how to meausure and use website speed with Google PageSpeed Insights. I tried to prepare a good topic, I hope you all like it.

What Is Google PageSpeed Insights?
Google PageSpeed Insights is a free speed test tool that allows you to quickly and easily test your site's loading speed and find out what is slowing your site down.

Google PageSpeed Insights also helps your site be more mobile friendly.
Also, you don't have to use PageSpeed Insights only for your own site, you can also test speed for any site. It also does not limit how many times you can test.
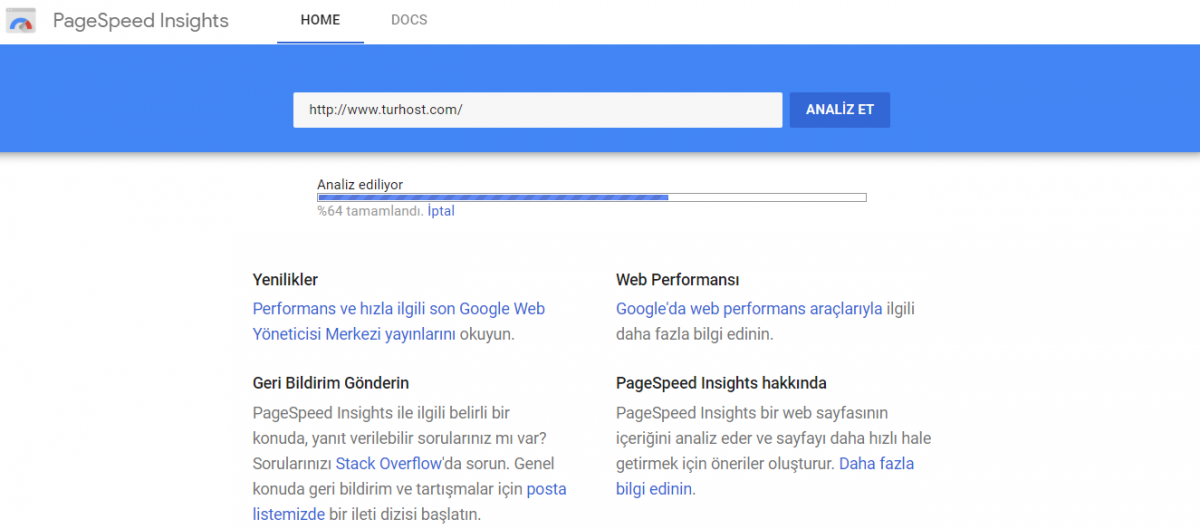
When you enter your website address into the query tool of PageSpeed Insights and click the "Analyze" button, you are left with a detailed report consisting of a list of suggestions for slowing down your site and what you should do.

How To Understand PageSpeed Insights?
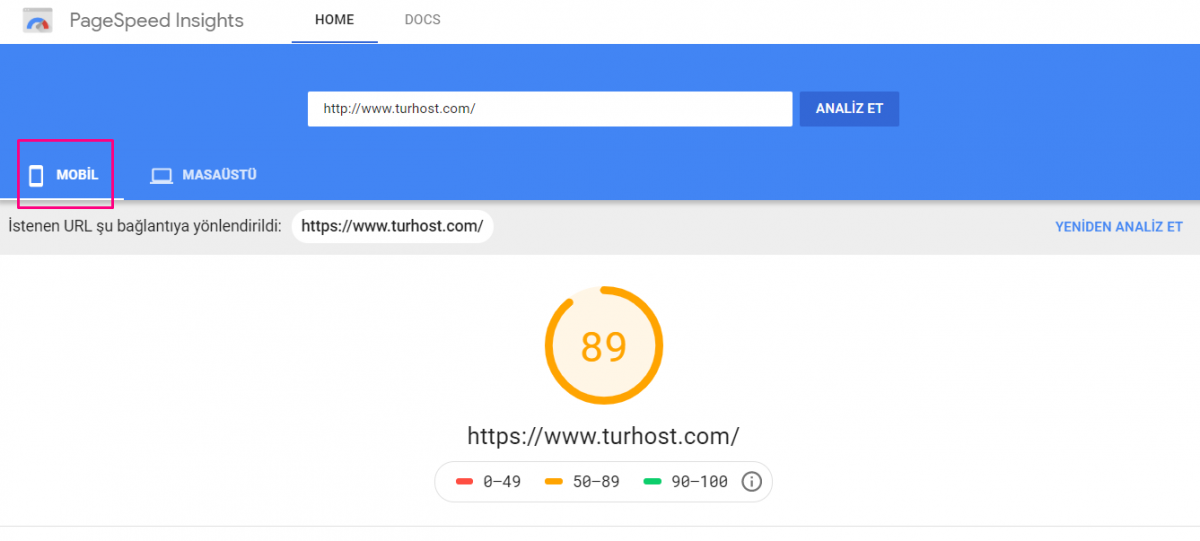
Every time you read a PageSpeed Insights report, you should remember that the first screen presented is on your site's mobile performance! You can switch to the pages where your desktop and mobile reports are located at the top left of the screen.
The color scheme (green check, orange circle, red triangle) in the recommendations section makes it easy to identify top issues affecting your website performance.
Too many red and orange colors in your report mean there are some loading issues on your page.
Speed Score
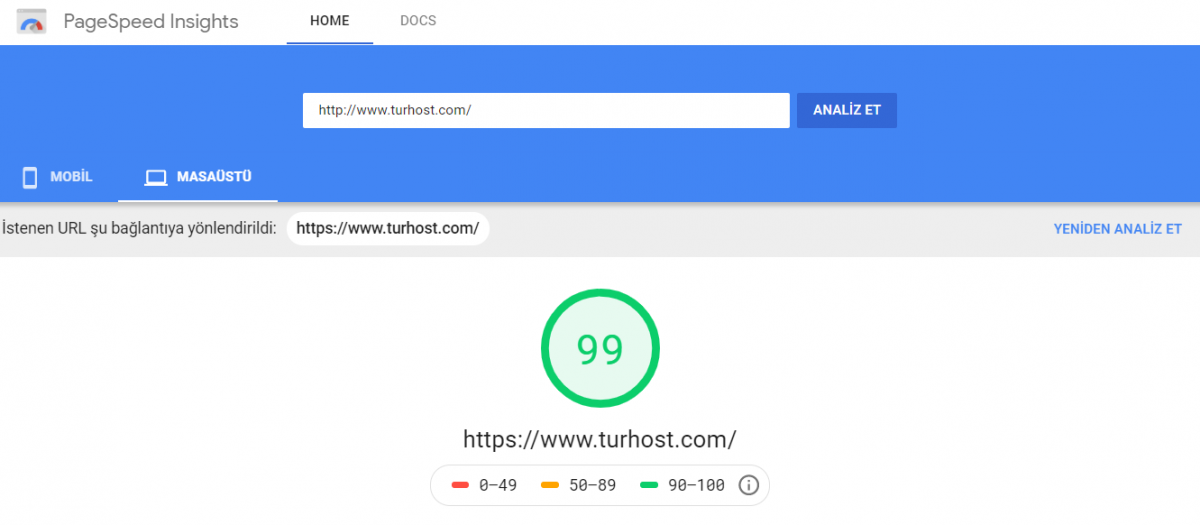
PageSpeed Insights uses speed scores for mobile and desktop devices, ranging from 0 to 100 points and showing your website performance.
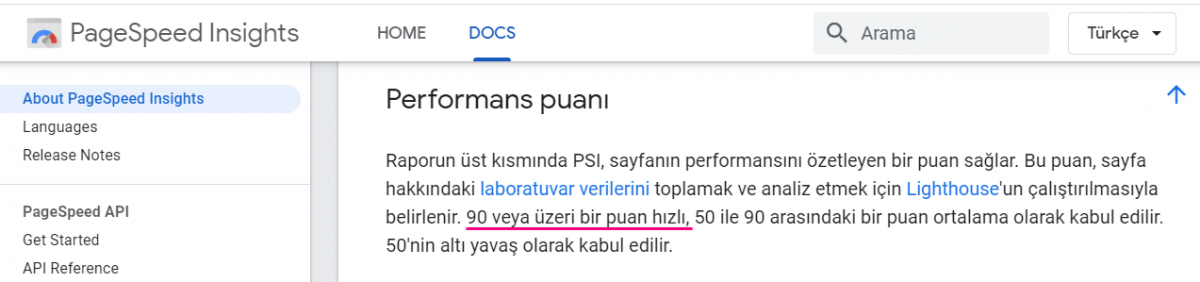
Speed score basically summarizes the performance of a page. Scores of 90 and above mean that the page is performing well.
Lab Data
Lab data is obtained in a controlled environment, that is, with a set of predefined devices and network settings. It is effective in debugging performance issues but may fail to capture problems in real world.
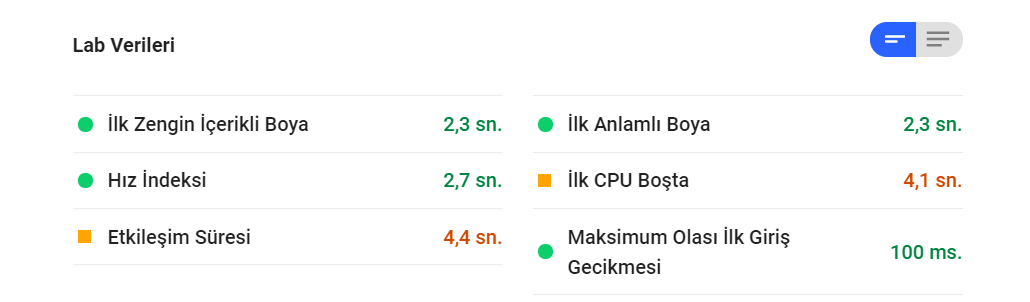
First Contentful Paint: Sayfanızdaki en önemli unsurların (hero content), sayfanın tamamının yüklenmesini beklemeden, bir anlam ifade edecek şekilde gösterilmesine kadar geçen süreyi belirtir. Sayfanızda önce en önemli ögenin yüklenmesini sağlarsanız, ilk zengin içerikli boya değeri azalır, yüklenme süresi kısalır!

First Meaningful Paint: It refers to the time it takes for the most important elements on your page (hero content) to be displayed in a meaningful way from waiting for the entire page to load. If you get the most important item to load first on your page, the initial rich-content paint value decreases, the load time is shorter!
Speed index: It shows how quickly the content of a page is filled. The lower the better. To lower your Speed Index score, you need to optimize your page visually to load faster.
First CPU Idle: It is the measurement of a page when it is least interactive. It is recommended that you minimize the number and size of required or "critical" resources that must be downloaded or executed before the page can be loaded.
Interactivity: It measures how long it takes for a page to become interactive. To increase your TTI interaction score, you should postpone or remove unnecessary JavaScript work that occurs during page loading.
Estimated Input Latency: Your application has 100ms to respond to user input. When it takes longer than that, the user will perceive the application as delayed.
Your goal should be to achieve all of these six criteria marked with a green indicator.
Domain Data
Once your website fully loaded, the speed test result, where you will also see a screenshot of your page, provides area data graphs with color percentages.
Domain Data; It is called Real User Manager or RUM. Contains performance data from actual page loads. Effective in capturing real-world user experience, but limited set of metrics and debug potential
The first rich content paint (FCP) and first input delay (FID) are represented by green, orange and red bars, respectively, in three categories, Fast, Average and Slow.
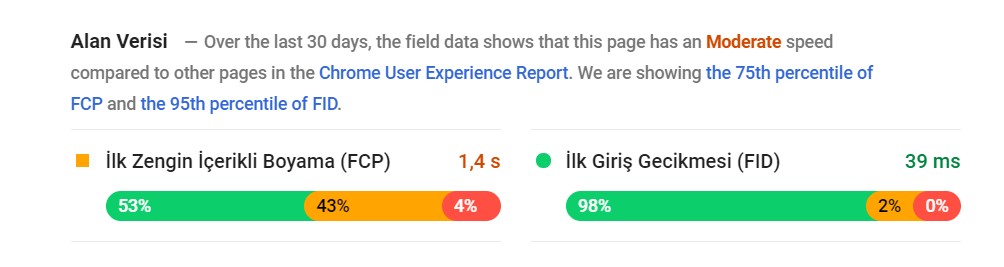
FCP, As we explained in the lab data above, it shows the time it takes for the most important items on your page to display before the entire page loads.
FID, It measures the time from when a user first interacts with your site (eg, when they click a link, tap a button) until the browser responds to the interaction.
Opportunities And Analyse
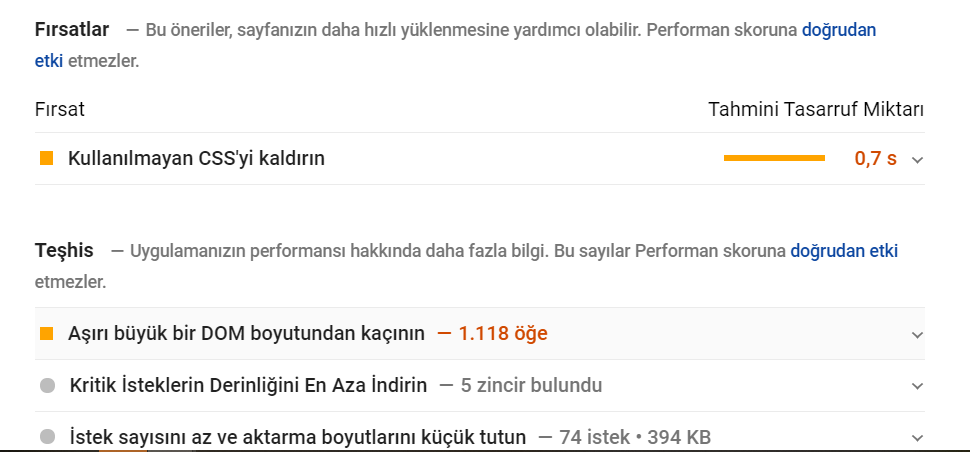
Opportunities section of PageSpeed Insights; shows suggestions that could increase the page load time, and an estimated load time that will save if the suggestion is implemented.
The Diagnostics section provides information on issues that do not directly affect your speed score.
Successful Inspections
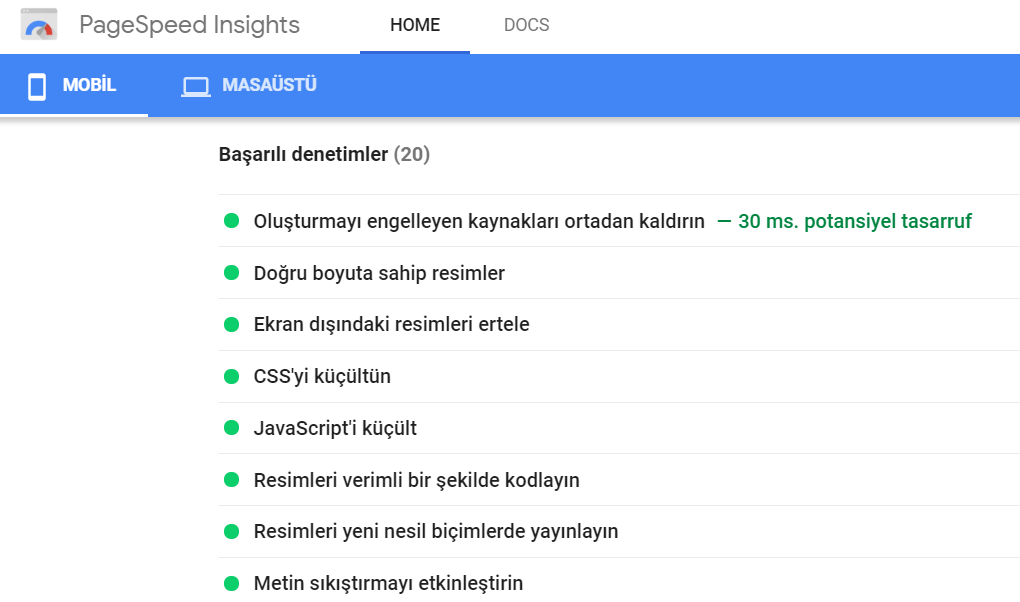
Successful Inspections Section, contains all the performance checks of your page that do not require any intervention. You can view the successful inspections section as a field that shows items that have a good score but can still be improved.
Optimization Suggestions
These are the most common optimization suggestions Google PageSpeed Insights offers at the end of the speed test:
=> Compressing pictures
=> Browser caching
=> Minimization of HTML files
=> Using Accelerated Mobile Pages called AMP
=> Minimizing JavaScript and CSS code and removing unnecessary code
=> Moving JavaScript and CSS files to the bottom of the page
=> Shortening server response time
=> Using CDN
How to Calculate PageSpeed Insights Score?
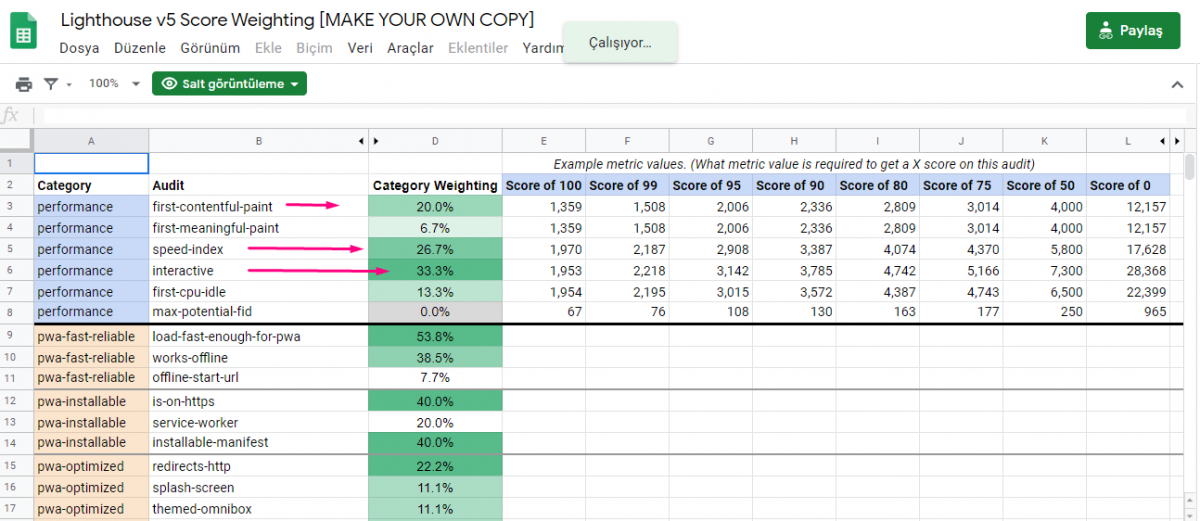
The speed score consists of 6 metrics of different weights that make up the lab data (meanings are in the Lab data section above):
=> First contentful paint
=> First meaningful paint
=> Speed index
=> First CPU idle
=> Interactivity
=> Max. potential fid
If your site gets low load times in the six performance units mentioned above, the speed score will increase.
I'm waiting for your feedback and comments. They're important to me.
") )
)Now, we've came to the end, thanks for reading.
Sincerely. :mml //contains quotation.
Source: https://www.turkhackteam.org/google-yandex-alexa-yahoo/1936862-google-pagespeed-insights-nedir-nasil-yorumlanir.html
Translator: Dolyetyus
Son düzenleme: